The Paid Occupancy Analysis tool allows you to analyse the occupancy data in the same way as other analysis tools do.
| Reference: See Analysis pages in the WebOffice User Guide for a description of the working of the tool. |
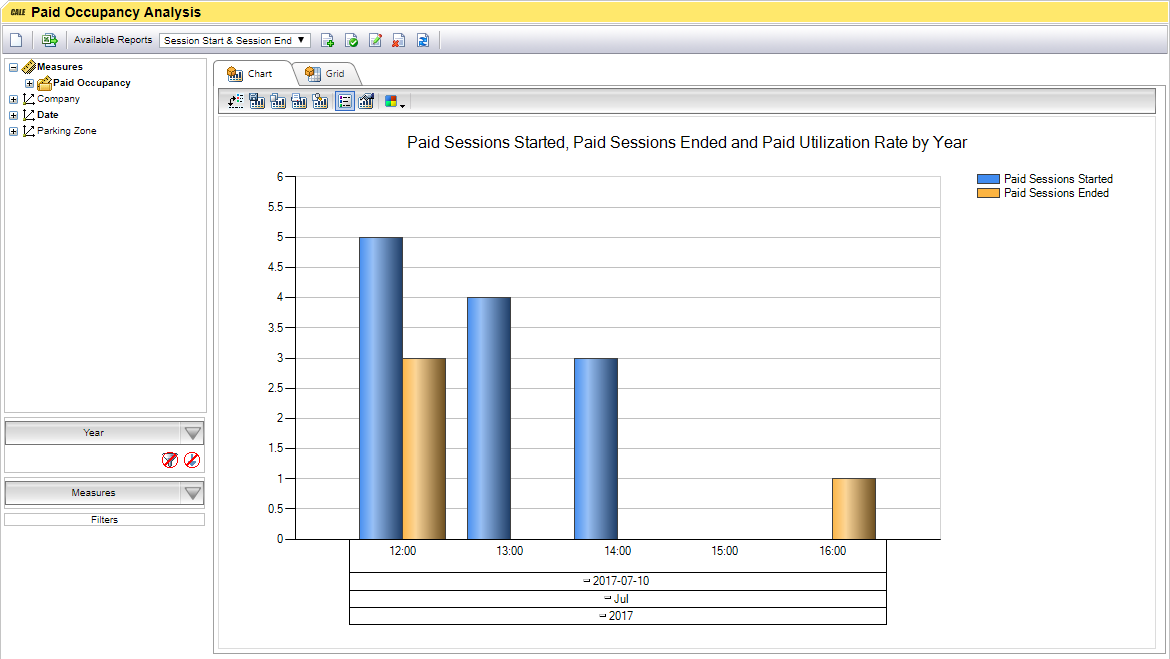
The Historical occupancy is calculated per hour. This means that if a purchase is started between 12:00 1nd 13:00 there will be 1 session start for this purchase. If this purchase ended between 16:00 and 17:00 there will be a session end for this purchase. In the example below there are 12 sessions started between 12:00 and 14:59 but only 3 are ended.
this means that at least 9 sessions are longer than one hour. Maybe even more.

In this graph 5 sessions are started between 12:00 and 13:00 and 3 are ended. The 3 ended do not necessary mean they are started in in the same interval
Occupancy Analysis Measurements.
Measurement |
Explanation |
Values |
|---|---|---|
Paid Sessions Start. |
The start of a purchase session. |
|
Paid Session End. |
The end of a purchase session. |
|
Paid Session Occupancy. |
The occupancy rate of the parking zone. |
Percent. |
Occupancy Analysis Dimensions
Dimension |
Explanation |
Values |
|---|---|---|
Parking Zone. |
Parking zones as defined in Parking Zones. |
displayed per parking zone. |
