This page allows you to render a chart about the occupancy.
Select the Operator and Zone and click Execute to render the chart. You can select one zone or all zones for the operator.
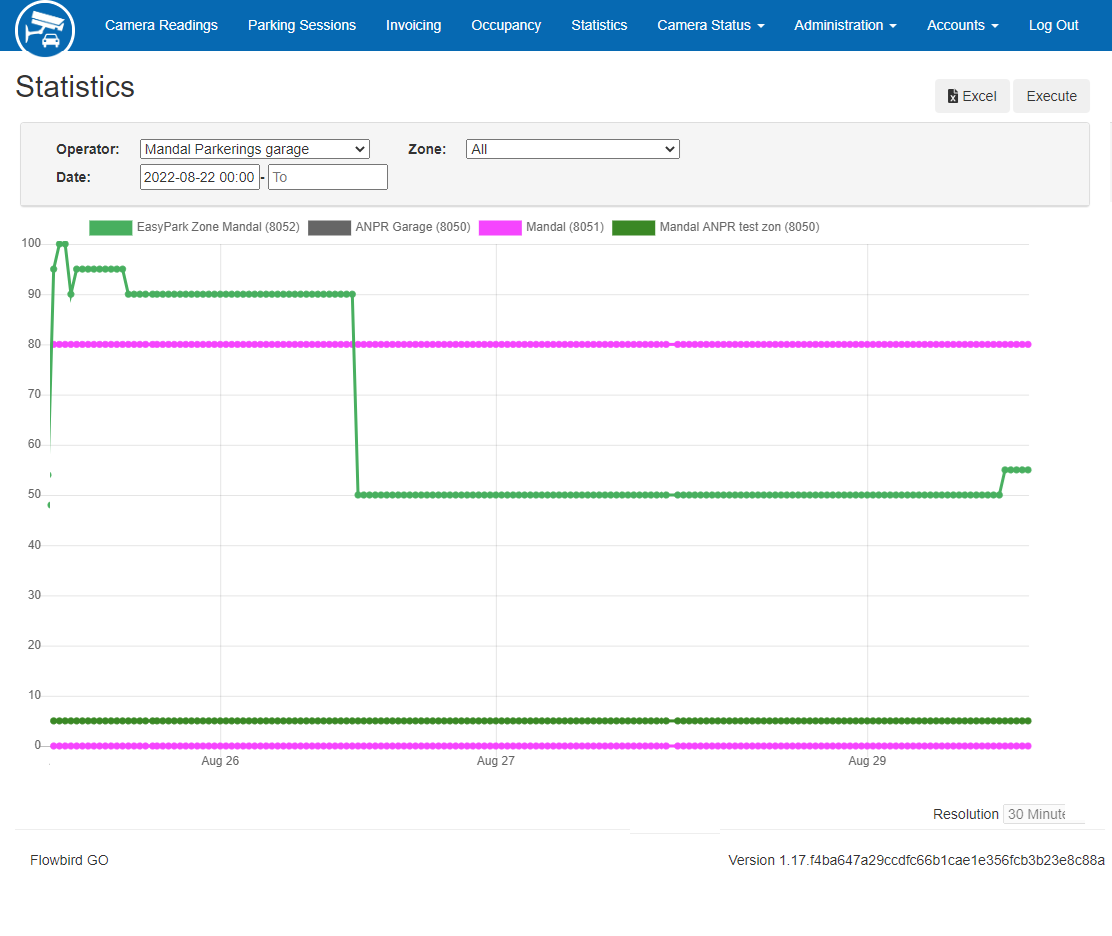
This page displays the Occupancy Statistics chart for the selected operator(s)
•The default period is one week back in time
•When selecting All operators, you will see all the zones you have access to.
You can always select a single zone.
•Setting a very long period; e.g., 6 months or more; will take a long time to generate.
When exporting to Excel, the columns Zone, Date created, and Occupancy will be available. The table is ordered on Zone and Date created.
The Occupancy Statistics chart is improved by regeneration occupancy history data point when user adds new Occupancy Reference point. Occupancy Reference is nothing else then a point in past from where we count how many parking spaces are occupied overriding system calculation. Then the system counts the occupancy from this reference point.