The Table creator tab enables you to create customized tables based on your preferences, displaying revenue and volume categorized by a selected dimension and time interval. The tables can be then exported, allowing for simple sharing and archival of analysis snapshots.
How to use it: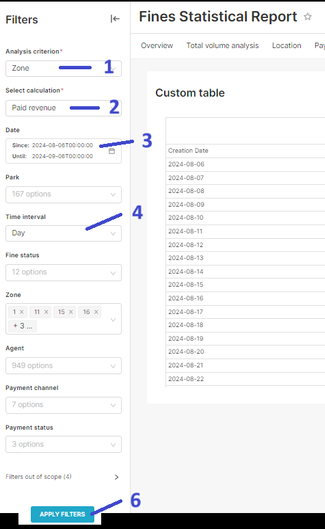
1.Select Analysis criterion (columns in the table - to split revenue and volume by dimension).
2.Select Calculation (the dimension the user is interested in, such as total revenue or total volume or paid revenue).
3.Select Date.
4.Choose Time Interval (Row Configuration - to distribute revenue and volume by specific time intervals).
5.Add any necessary filters to refine your results (optional).
6.Click on Apply Filters to view your customized table.
The table below is created for the total volume and payment channel for the last 31 days
The table displays a day per row the volume for each payment channel. channels with no payment that day are left blank

Example of a custom table