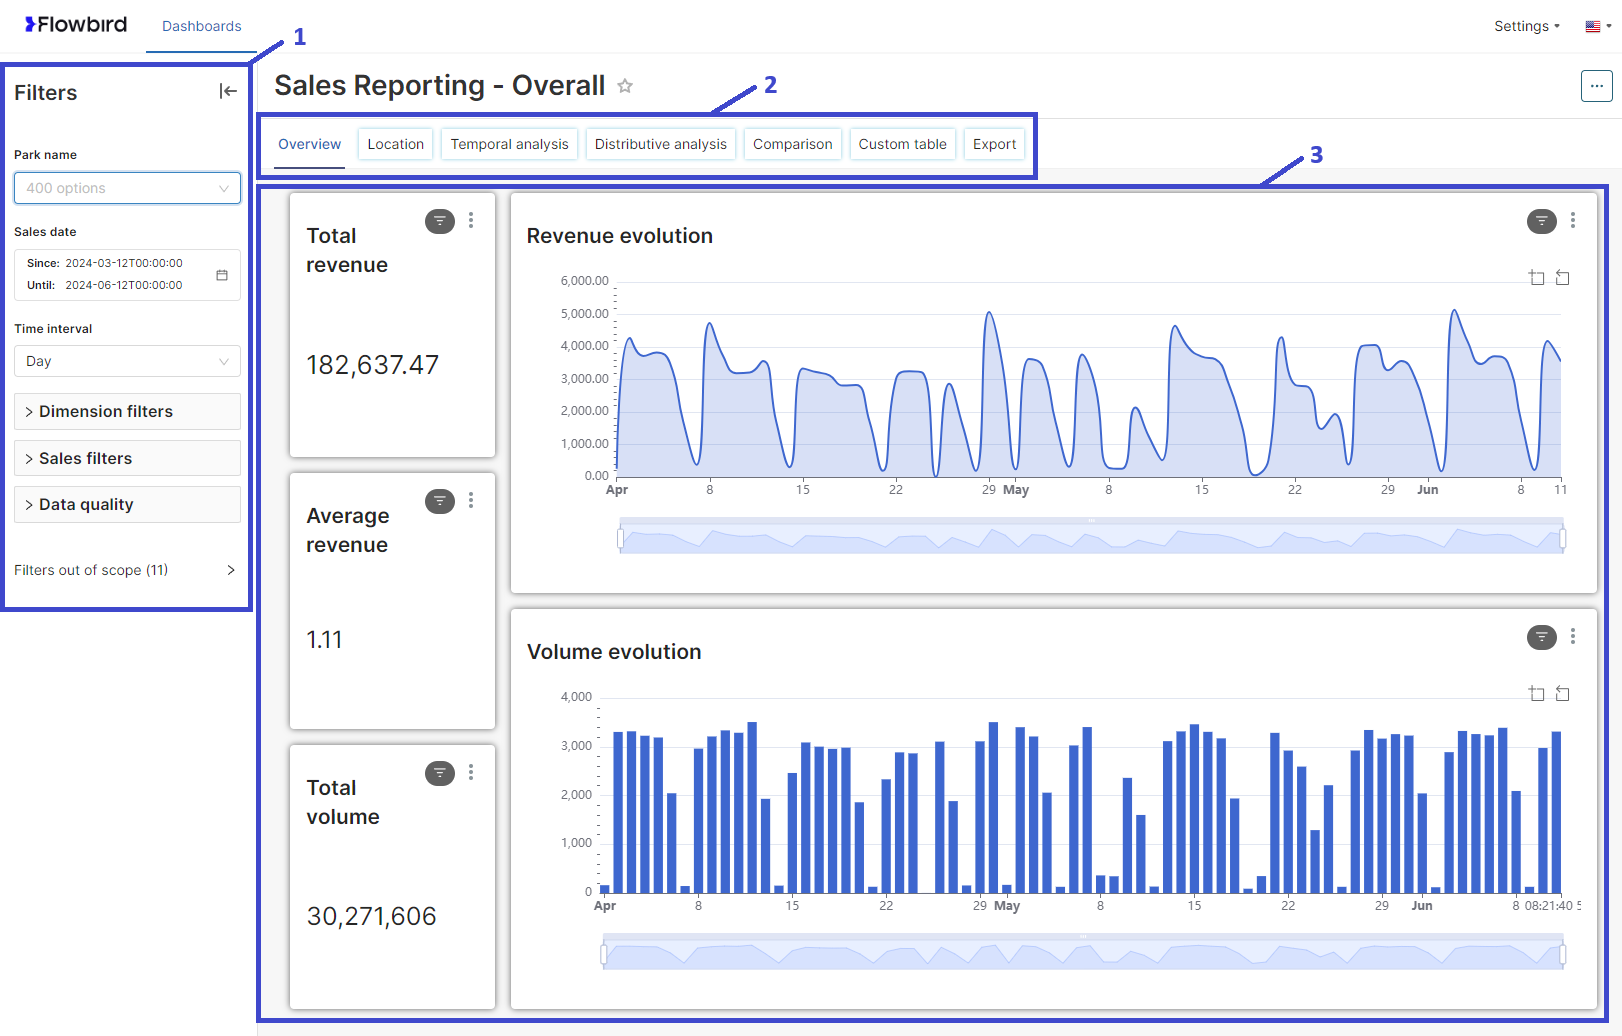
1.Filter panel
Here, the user can change the scope of the data displayed. Every expandable section includes a predefined set of filters for each filter section. While applying the filter, all data widgets displayed in the tab will be affected, unless told otherwise.
2.Tab selector
Here, the user can switch between different views on sales data. Each tab represents a different data presentation, with its layout and set of widgets.
The following tabs are available:
oOverview tab - provides an overall view of revenue and volume for all available products within a park.
oLocation tab - presents a map where physical sales took place as well as the distribution of sales across all channels (including digital).
oTemporal analysis tab - presents the trend and distribution of revenue and volume based on a chosen data perspective (product type, sales application, etc.).
oDistributive analysis tab - similar to Temporal analysis but here two dimensions can be selected to analyse one in the context of the other (for example which products are sold in different sales channels).
oComparison tab - enables to compare two distinct periods of sales in one unique page of graphs.
oCustom table tab - allows building custom revenue and volume tables based on the filter selection.
oExport tab - presents a data grid which contains detailed information about sales transactions.
| The number and content of the tabs can differ from report to report. |
3.Data presentation
The data presented is based on the filters selected and applied. The data that matches the selected criteria will be displayed in this section . The form in which the data is displayed is pre-defined (set of widgets or tables) and depends on the tab selected.