The Total volume analysis tab presents the trend (evolution) and repartition (distribution) of fines based on the analysis criteria selected.
Possible analysis criteria:
Select one or more zones and/or agents for a more details view
•Zone
•Agent
Widgets
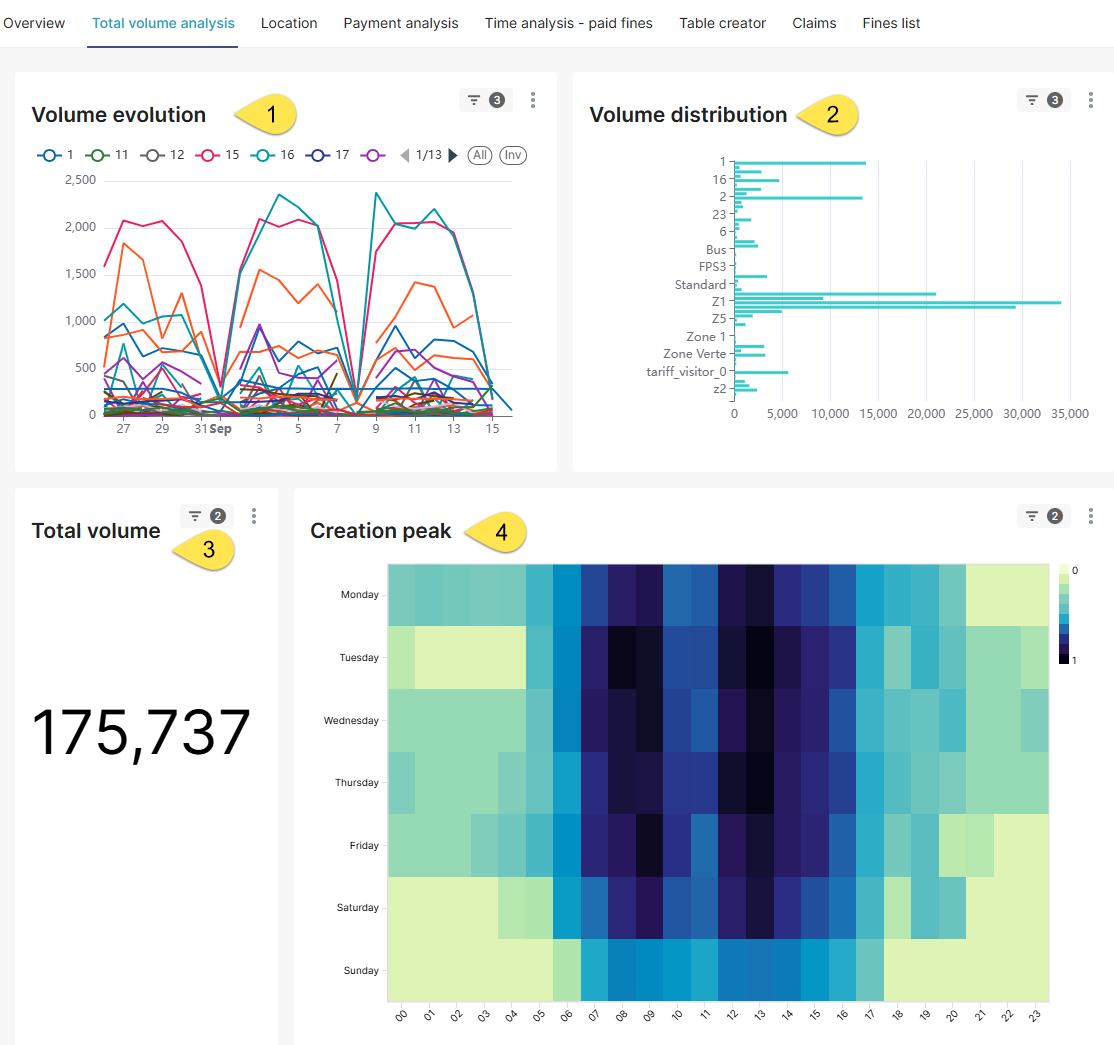
1.Volume evolution
Presents the trend (evolution) of fines volume across various categories coming from the selected analysis criteria based on the selected filters and period.
2.Volume distribution
Presents the distribution across various categories coming from the selected analysis criteria based on the selected filters and period.
3.Total volume
Presents the total fines volume based on the applied filters.
4.Creation peak
Displays the frequency of issued parking fines in given hours (horizontal axis) on given weekdays (vertical axis). The heat map uses colour gradients to represent the intensity of fine creation, with areas showing more fines issued appearing in more intense (e.g., dark blue) colours, and fewer fines in less intense (e.g., white) colours.