| Menu | Reports & Statistics -> Top 10 Statistics -> Top 10 statistics by terminal. |
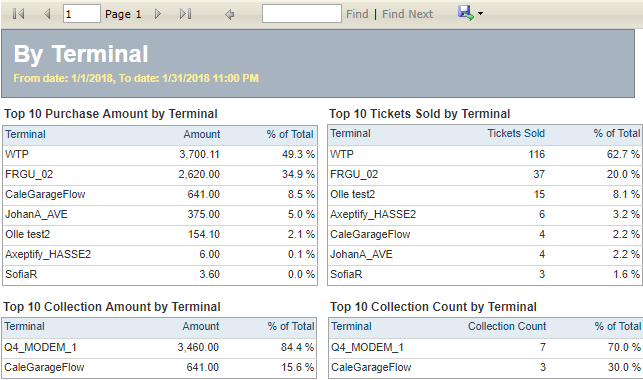
This report shows the top 10 terminals concerning purchase amount, number of tickets sold, collection amount and the number of collections made.
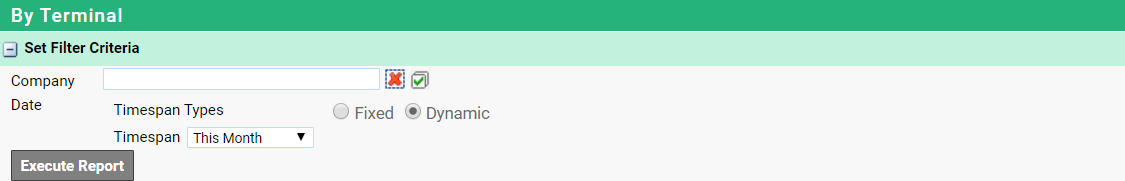
1.Select the desired time span type.
Fixed: Allows you to specify an interval of fixed dates and times, e.g. from the 21st of May at 09.00 to the 21st of June at 23.59.
Dynamic: Allows you to select a dynamic time span, e.g. The Last Week or This Month. For explanations, see chapter 3 General Functions.
Filter the report as desired. For instructions on filtering, see chapter 3 General Functions.
2.Click Execute Report to generate the report.