Measures are typically dragged into the Chart/Grid area to be displayed. They are then made visible on the y-axis/column. Measures can however be swapped to the other axis using drag and drop or the Pivot toolbar button.
Sorting Measures.
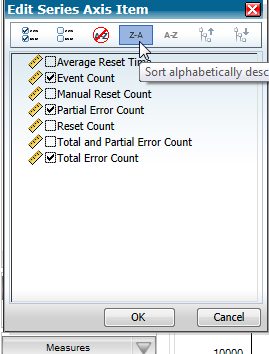
By default, measures are displayed in the order that they are defined in the Dimensions & Measures area. There is no way to specify manually in which column a certain measure should be displayed, but the measures can be sorted in ascending or descending order using the Edit Series Axis Item dialogue: