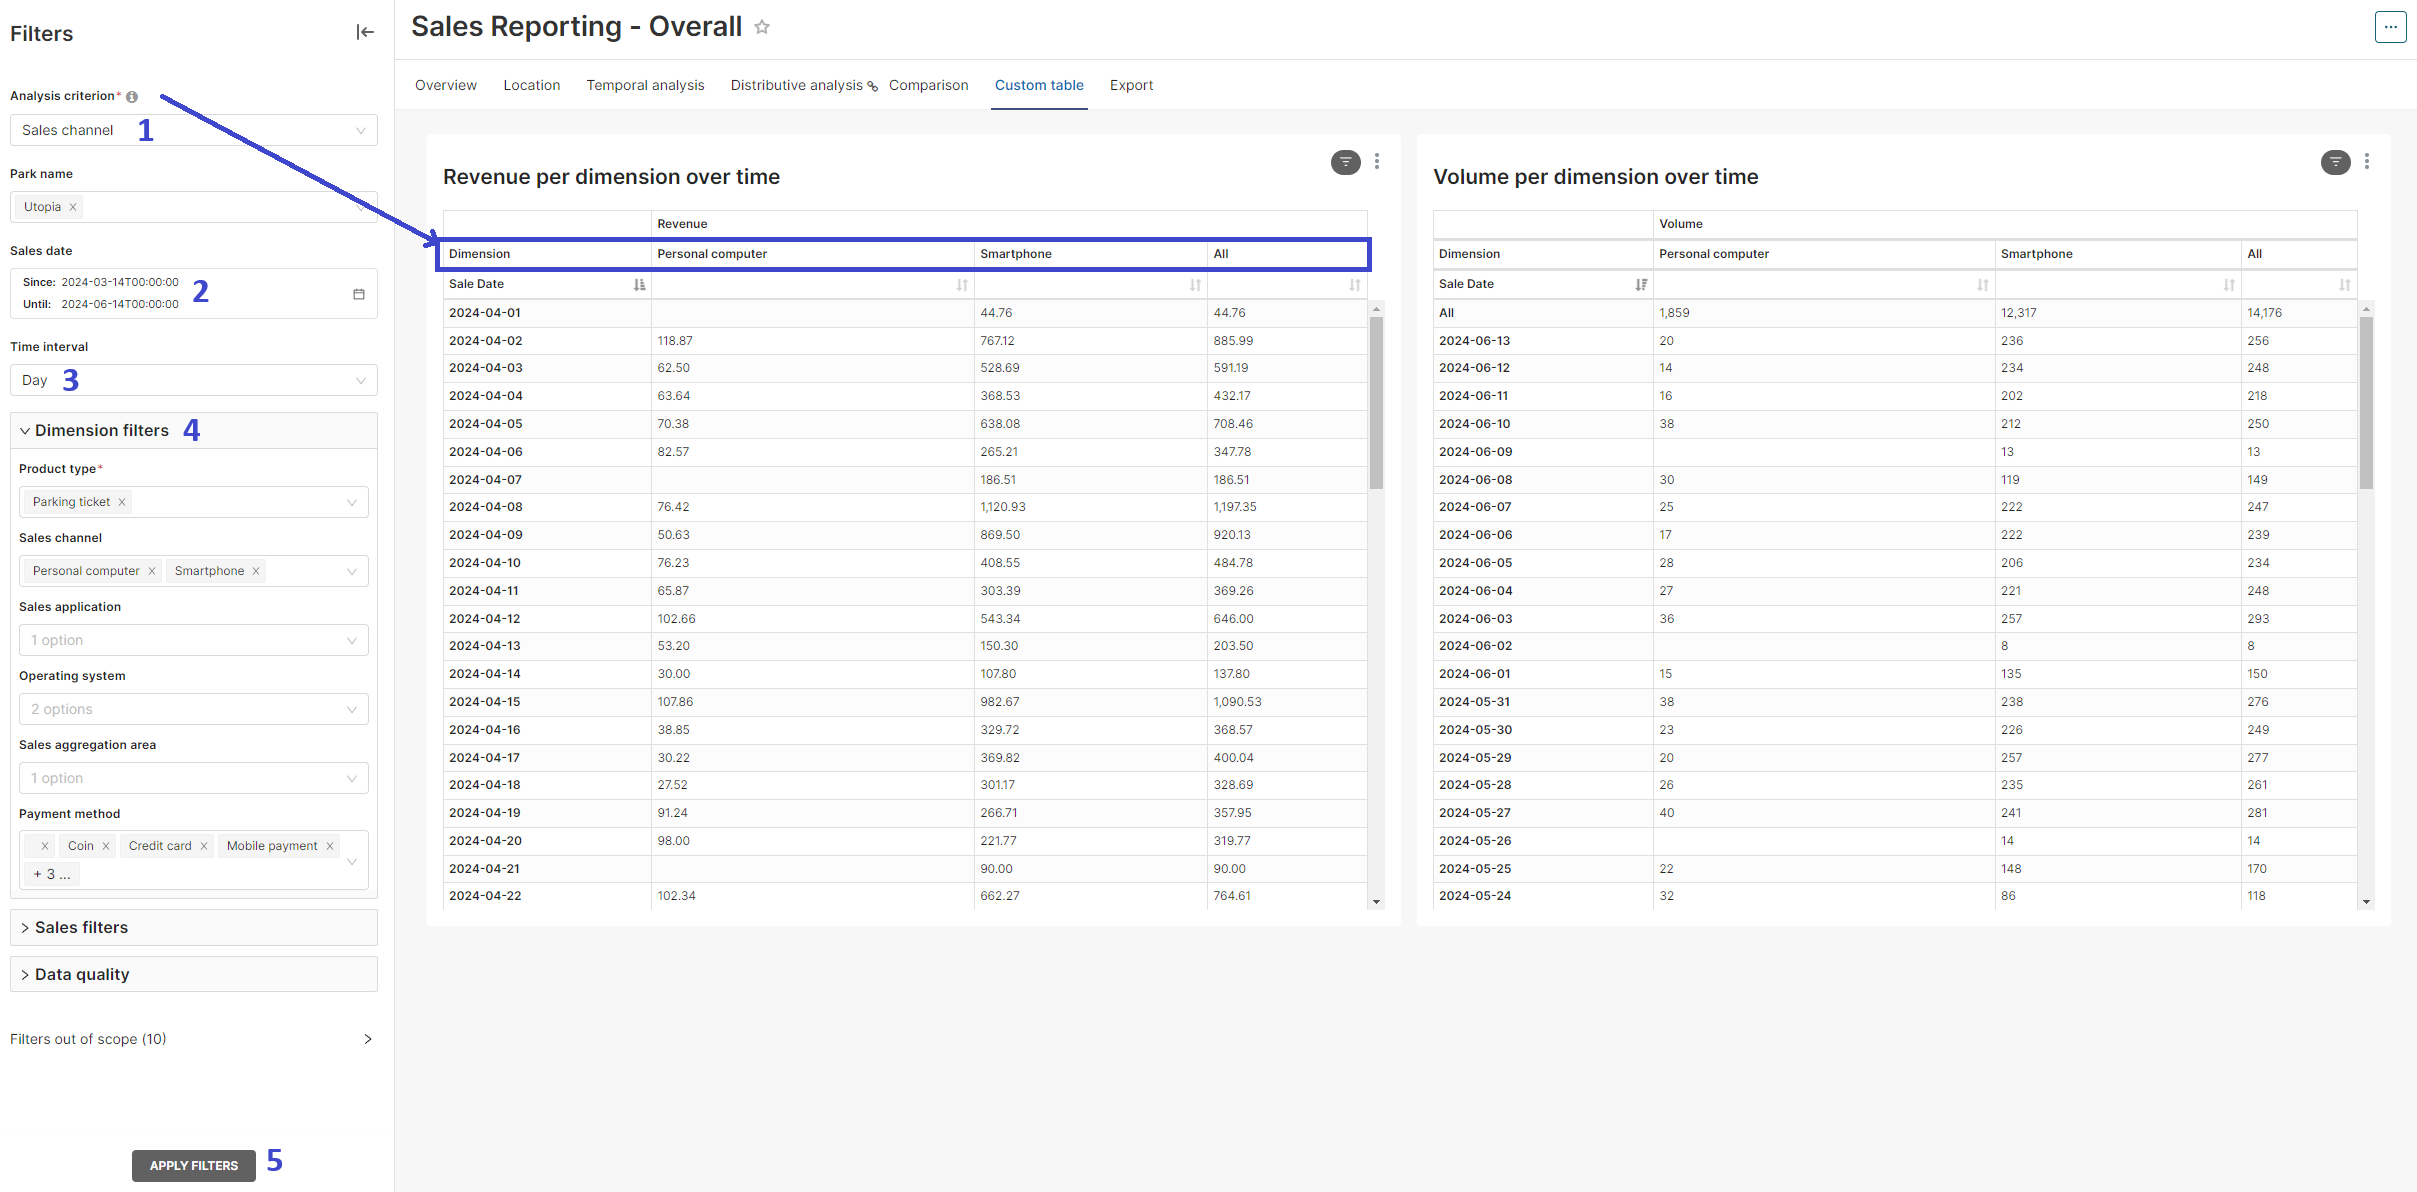
The Custom Table tab enables users to create customized tables based on their preferences, displaying revenue and volume categorized by a selected dimension and Time Interval. The tables can be then exported, allowing for simple sharing and archiving of analysis snapshots.
How to use it:
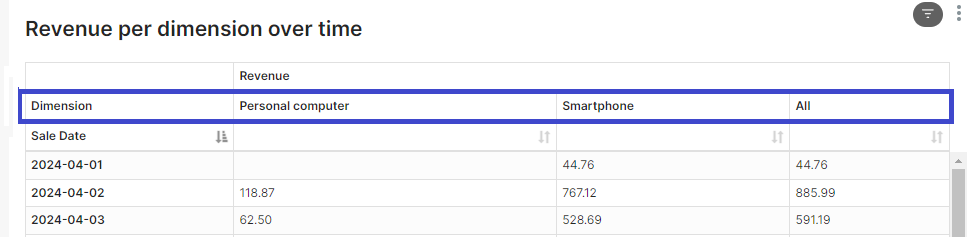
1.Select the Analysis criterion (columns in the table - to split revenue and volume by dimension)
2.Select Sales Date
3.Choose Time Interval (Row Configuration - to distribute revenue and volume by specific time intervals)
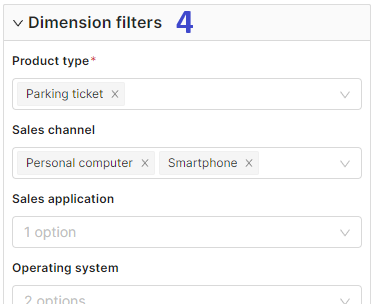
4.Add any necessary filters to refine your results (optional)
5.Click on Apply Filters to view your customized table.