The Comparison tab allows selection of two distinct periods to compare them in terms of trends and distribution for both revenue and volume of data narrowed down by the filter selections.
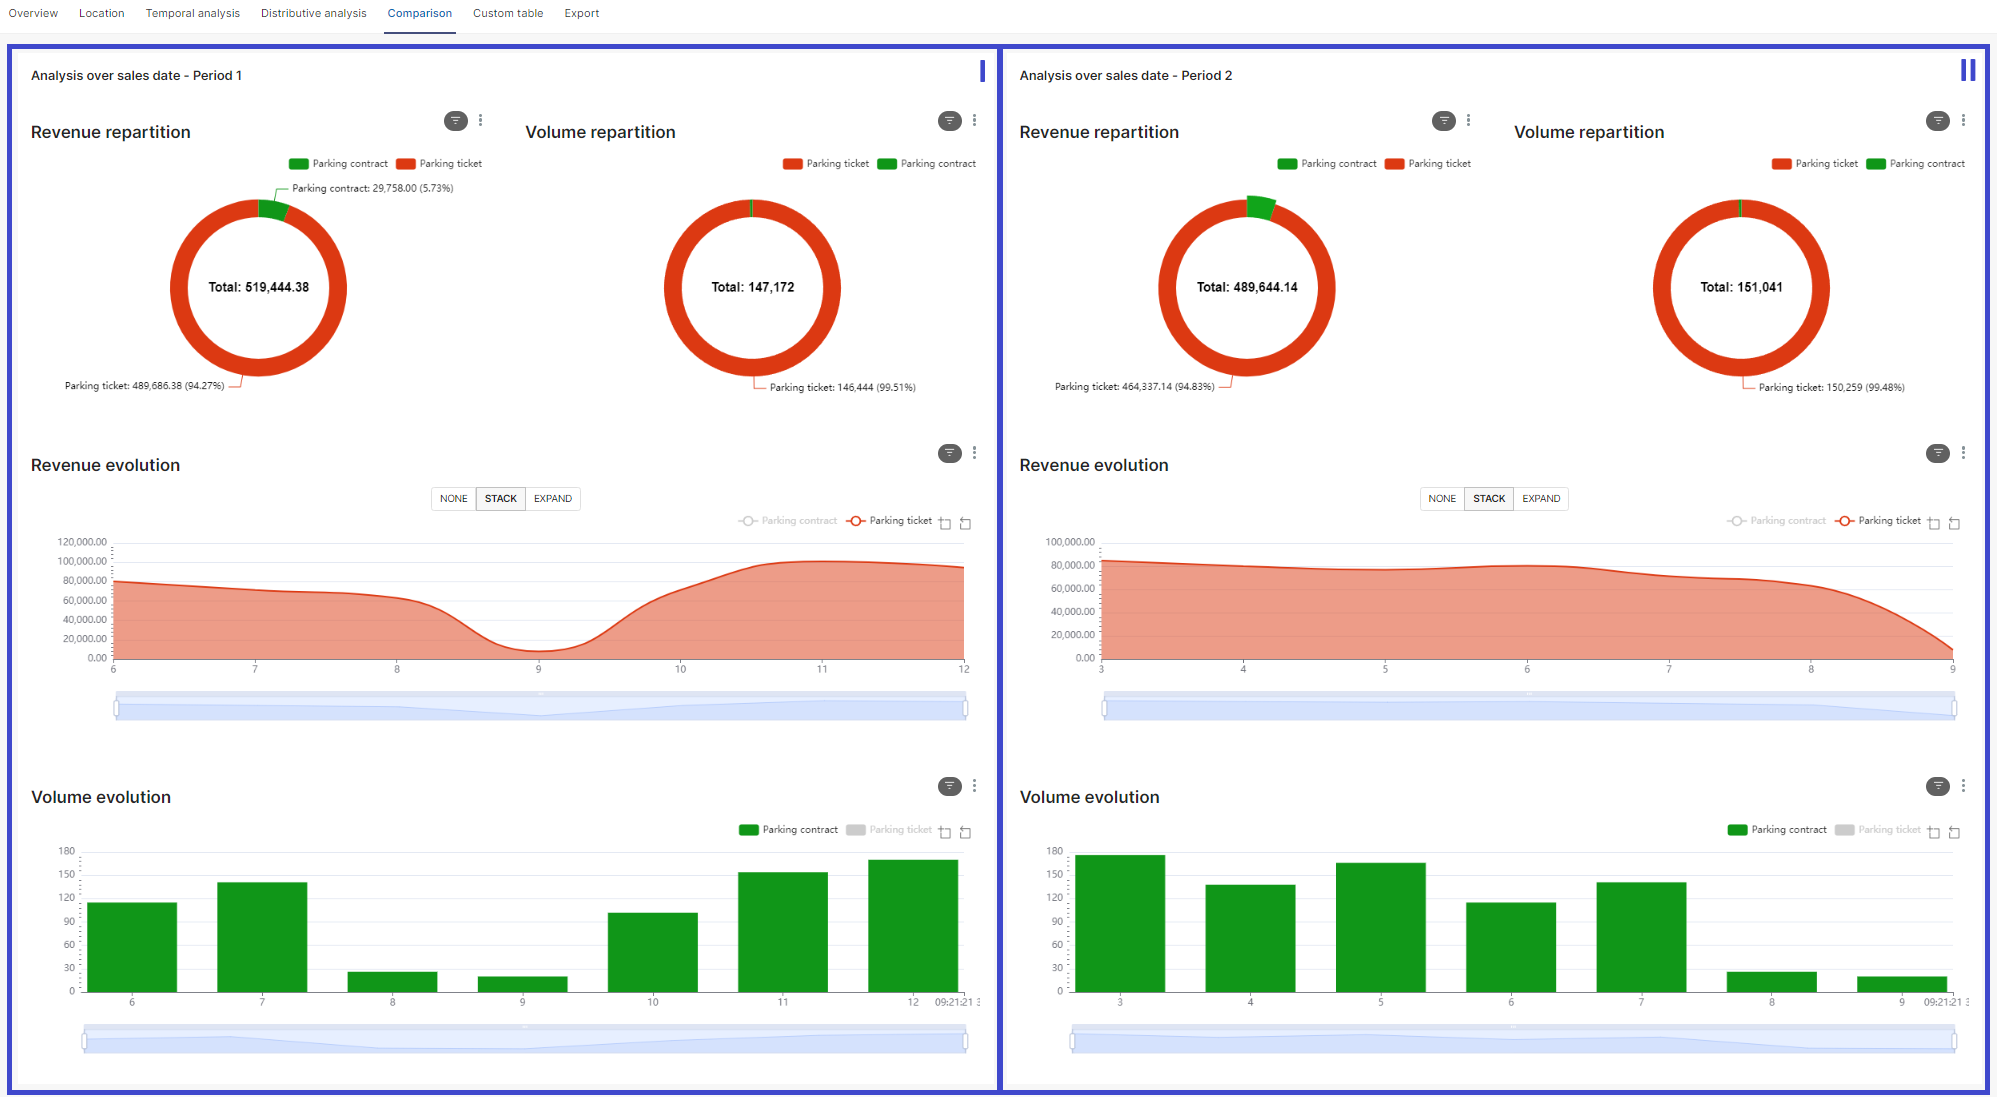
The data presentation panel is split into two parts (I and II in the screen-shot above). Each part contains the same content as the Temporal analysis tab and is presenting the data from period 1 (P1) on the left and data from period 2 (P2) on the right. This allows for a side-by-side comparison of the two periods.
How to use it:
•Select Sale Date for Period 1 (see Using Date Pickers Filters)
•Select Sale Date for Period 2
•Click on the "Apply Filter" button to compare the selected metrics between the two periods.