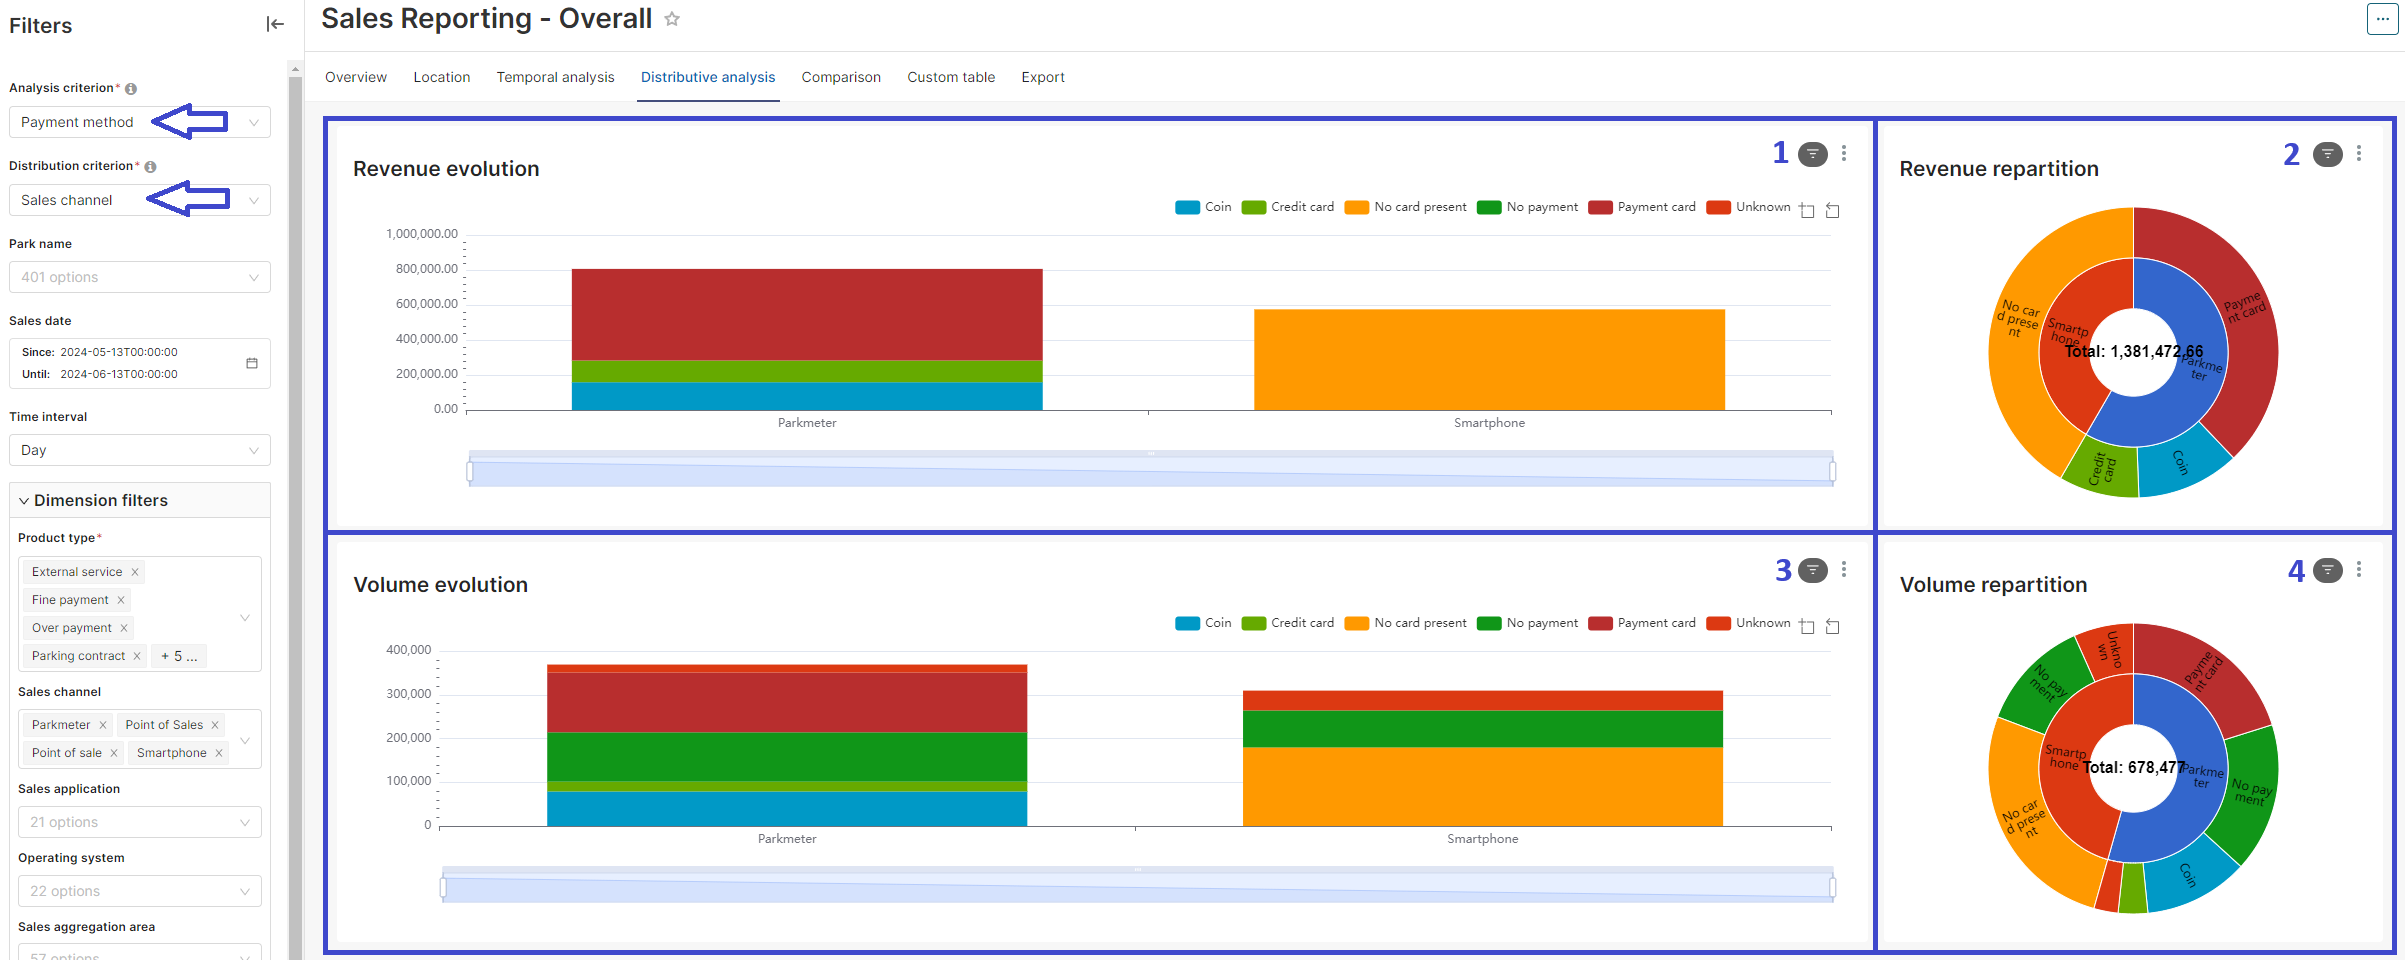
The Distributive Analysis tab lets you view data in two selected analysis dimensions based on your filters.
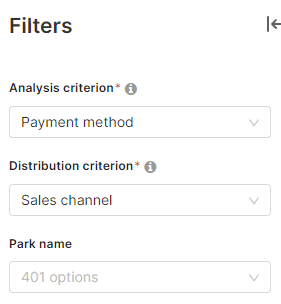
Filters:
To select the two dimensions to be analysed the ‘Analysis criterion’ and Distribution criterion' need to be selected from the filters panel. Available selections are the same as mentioned in Temporal analysis tab for both dimensions.
Widgets:
1.Revenue evolution:
Plots the categories from the ‘Distribution criterion' on the X-axis and indicates by bars the height of the order revenue for each of the categories.
What each of the bars is divided into, depends on the selection in the ‘Analysis criterion’ and the categories resulting from that selection.
2.Revenue repartition:
Criteria selected from the ‘Distribution criterion' and ‘Analysis criterion’ are brought on two layers of a sunburst graph.
The inner circle has the available categories from the ‘Distribution criterion' selection while the outer circle has the categories from the ‘Analysis criterion’ selection.
The outer circle shows to what orders revenue sub-sets the corresponding inner circle part has been divided.
The middle of the sunburst graph shows the total order revenue from the data selection based on the applied filters.
The sunbursts can be enlarged as described in Widgets
3.Volume evolution:
Plots the categories from the ‘Distribution criterion' on the X-axis and indicates by bars the height of the order volume for each of the categories.
What each of the bars is divided into depends on the selection in the ‘Analysis criterion’ and the categories resulting from that selection.
4.Volume repartition:
Criteria selected from the ‘Distribution criterion' and ‘Analysis criterion’ are brought on two layers of a sunburst graph.
The inner circle has the available categories from the ‘Distribution criterion' selection while the outer circle has the categories from the ‘Analysis criterion’ selection. The outer circle shows to what order volume sub-sets the corresponding inner circle part has been divided.
The middle of the sunburst graph shows the total volume from the data selection based on the applied filters.
The sunbursts can be enlarged as described in Widgets