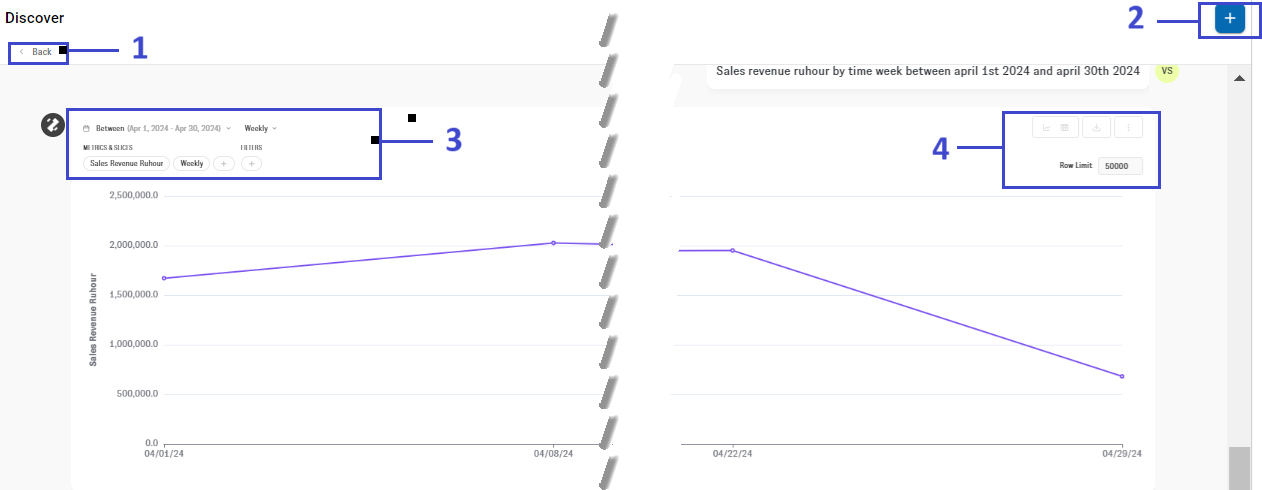
1.The Back Button allows you to exit the current chat and start a new conversation. This is useful when you want to begin a fresh query or task without any connection to the previous chat session.
2.The Expand Button is used to enlarge or collapse the chat window.
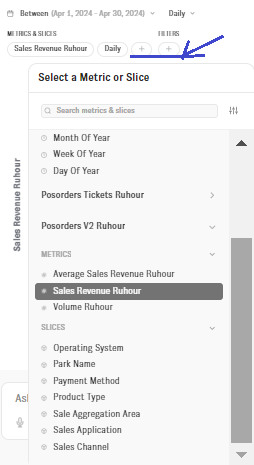
3.After receiving an answer from AI Assistant, the Filter Panel gives users the ability to further refine or adjust the results.
| When you adjust the filter settings on the widget, Assistant AI will automatically generate a new response based on the updated settings. |
You can use this feature to:
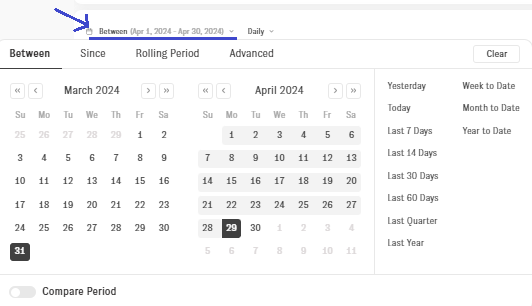
•Change Time Interval: Adjust the time period for the data displayed, allowing you to switch from a monthly to a weekly or daily view, or choose a different date range.
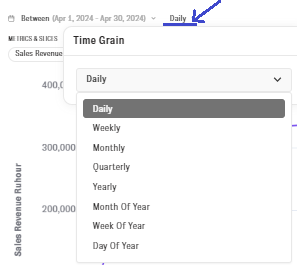
•Modify Time Granularity: Set the level of detail for the time-related data, whether you want to break it down by day, week, month and etc. This is particularly useful when analysing trends over different time scales.
•Select New Metrics or Slice: Introduce additional data points or KPIs to your result. For instance, you can request the inclusion of a new metric such as revenue , volume or slice by payment method, product type and etc.
•Each response generated by Assistant AI offers multiple ways to interact with the data and customize how you view, download, or explore it further. Below are the available settings:
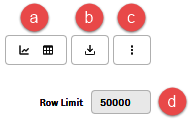
a)Change View: Graphical or Table

You can switch between two different ways of viewing the data:
▪Graphical View: Displays the data in a visual format, such as a bar chart, line chart, or pie chart. This is ideal for spotting trends and visualizing relationships within the data.
▪Table View: Shows the data in tabular format with rows and columns, allowing for detailed examination of specific numbers or values.
b)Download Options:
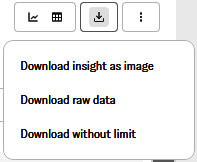
AI Assistant provides download options for exporting data:
▪Download insight as image: Saves the current view (graph or table) as an image file.
▪Download raw data: Downloads the underlying dataset (e.g., csv or excel format) for external analysis in spreadsheet tools or databases.
▪Download without limit: Exports the complete dataset, even if only a part is displayed in the response. This ensures you have access to all available data.
c)Additional Settings:
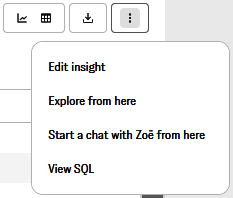
▪Edit Insight: Modify the current insight by adjusting metrics, dimensions, or filters.
▪Explore from Here: Go deeper into the data by creating new insights or looking at related metrics based on the current response.
▪Start a Chat with Zoe from Here: Open a conversation with Zoe, the AI assistant, directly from the current response.
▪View SQL: Displays the SQL query that was used to generate the current response. This is useful for users who need to understand the database logic behind the data or wish to use the query in other systems.
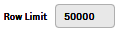
d)Change Row Limit
This setting allows you to adjust the number of rows displayed in the table view. You can set a limit on how many rows of data are shown at once, which is useful for focusing on specific sections of the data or managing large datasets.