The sales reporting dashboard enables you to review and analyse park activity within one or several parks. Through various dimensions and filters, you can refine the analysis.
The data is grouped for all combinations of products sold in orders such as parking tickets, permits and fines.
To access the reporting dashboard, select "Dashboard" from the reporting drop-down menu.
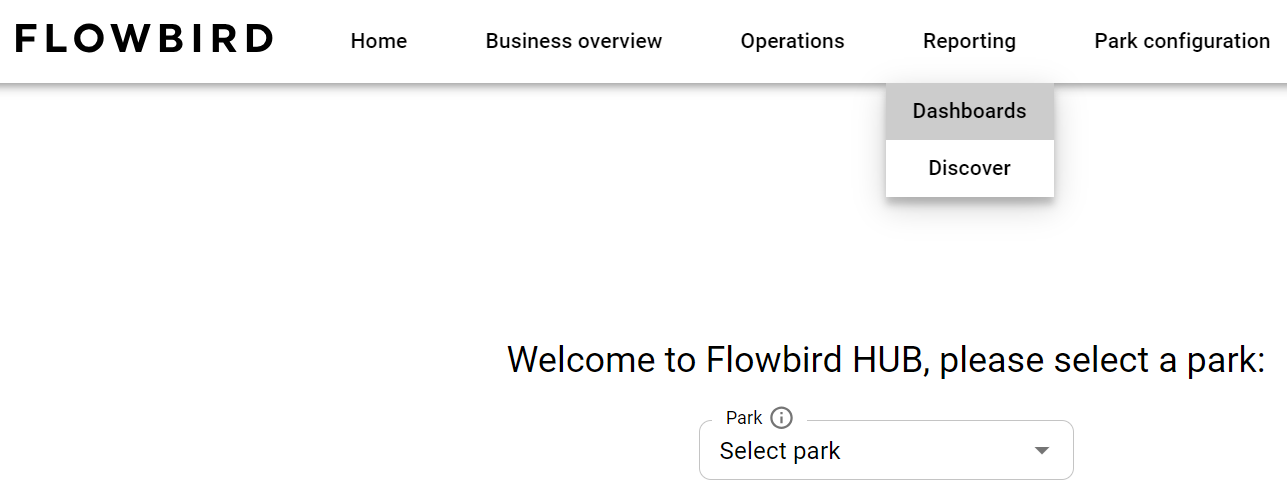
Make sure you have the correct park selected if you have access to more parks.
Menu bar
The menu bar in the top row of the Dashboard gives access to the Dashboard, Charts, and the dataset. The available choices depend on the rights in your account.
In the menu bar on the right, you can:
•create a new dashboard that fits your needs
•Adjust some setting like your profile and log out.
•Using the flag drop-down you can change the language if needed.
Dashboard menu option
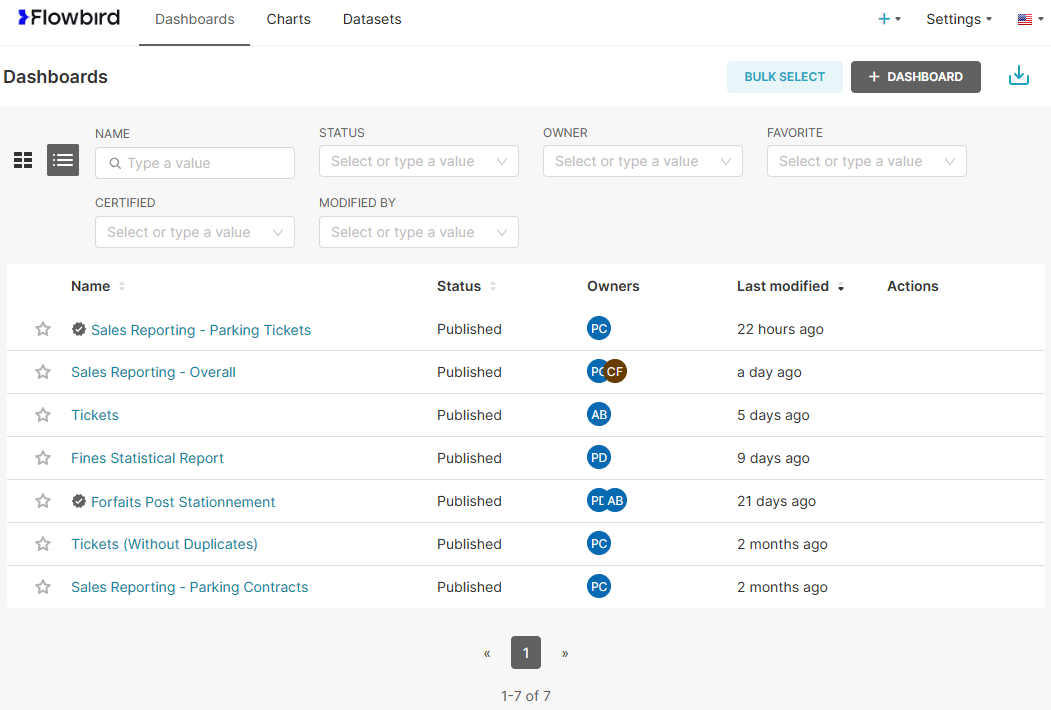
Clicking the dashboard option in the menu bar will (re)open the dashboard. It will default be displayed as a list with available reports.
reports with a  are Flowbird verified reports.
filter area
The dashboard has a filter area above the list of reports. Here you can search for a report.
At the left-hand side of the filter you will find 2 buttons to change between list view and card view
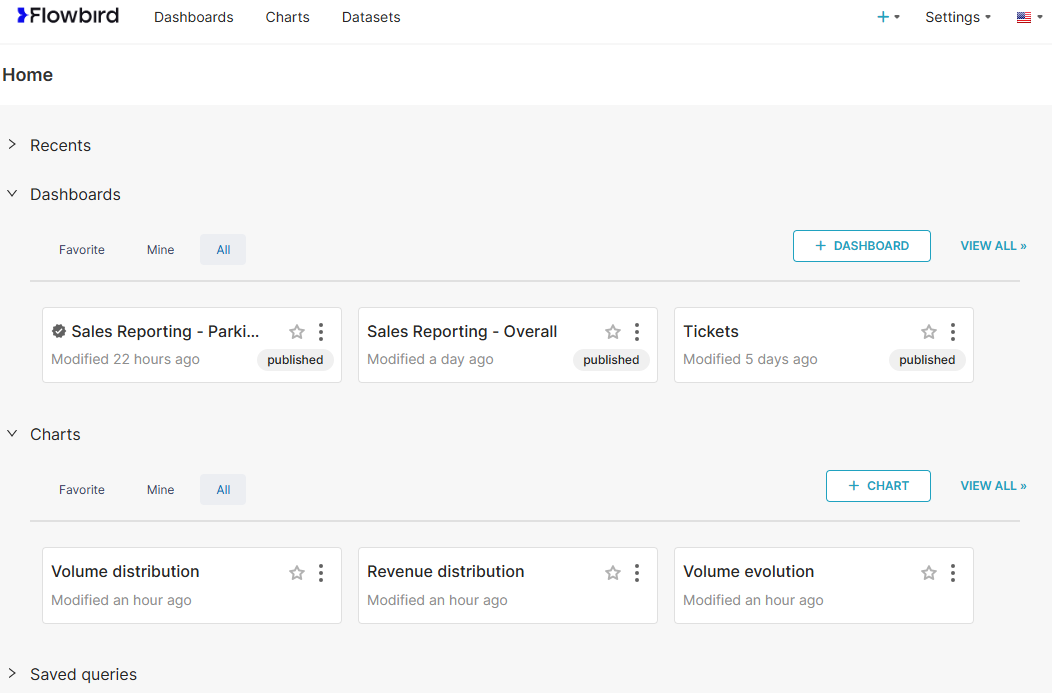
The use of the Flowbird logo
Clicking the logo will re-draw the dashboard in a different format. here you will find 4 expandable areas:
1.The "recents" area will list most recently used reports
2.The dashboard area will display all the reposts you have access to.
3.The charts area will display the charts you have access to
4.The Saved Queries will display any query you saved
The available choices depend on the rights in your account.