Create new analysis report.
Follow these steps to create a new Collection analysis report:
1.Open the Collection Analysis page.
2.You will see an empty report. If not, click the  button. The chart area is cleared.
3.In the tree view to the left, expand Measures > Collection.
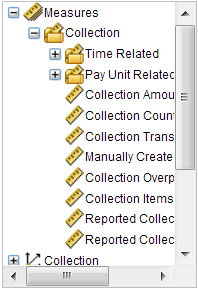
4.Use the mouse to drag the desired measure onto the display area. In this example, we will use the Collection Amount measure.
Since we have not yet selected a category to use as the second axis, no data is displayed on the display area. 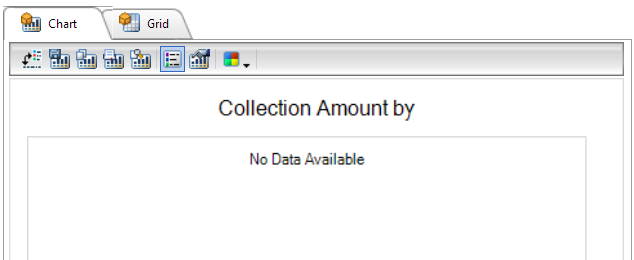
5.In the tree view, scroll down and expand Terminal:
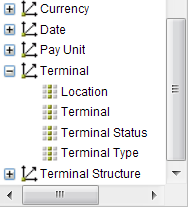
6.Under Terminal, drag Terminal onto the display area:
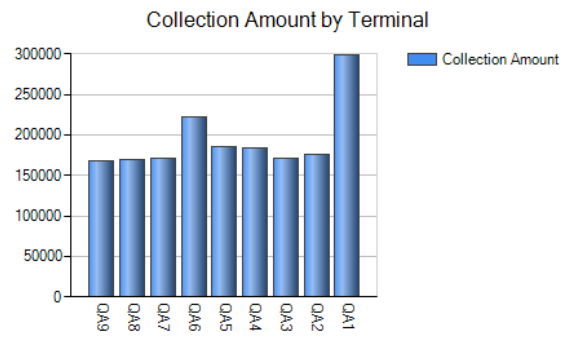
Now the display area shows a graph of collection amounts per terminal since system start. No time factor is yet added to the analysis. The actual visible data depends on the collections made on your terminals and will differ from the image above.
7.In the tree view, expand Date:
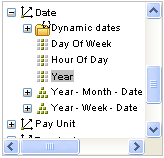
8.Drag Year onto the display area:
.")
Now the graph shows collection amounts by year and terminal (since system start).
As we have dragged different dimensions (measures and categories) onto the display area, new items have been added under the tree view on the left-hand side of the page:
Instead of dragging dimensions onto the display area, you can drag it onto this area (no difference). A third way is to right-click an item and select Add Dimension.
To remove a dimension from your analysis report, simply drag and drop it onto the tree view or right-click the item and select Remove Dimension.
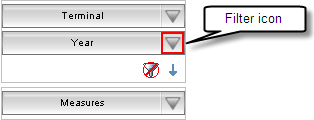
To change the measure dimension or add an additional measure dimension, click the filter icon on the Measures area and select the desired measure.
9.Now, click the Filter icon on the Year item. The following window is displayed:
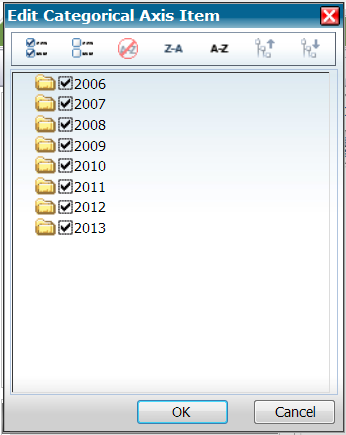
10.Deselect all years but e.g. 2013 and click OK.

The graph now displays collection amounts for 2013 only.
In the same way, you can limit to specific terminals by clicking the filter icon on the Terminal item.
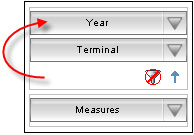
11.To sort the result in descending or ascending order, click the sorting icon . The icon changes to an up-arrow
  and the result is displayed in ascending order:
To change to descending order, click the sorting icon once again.
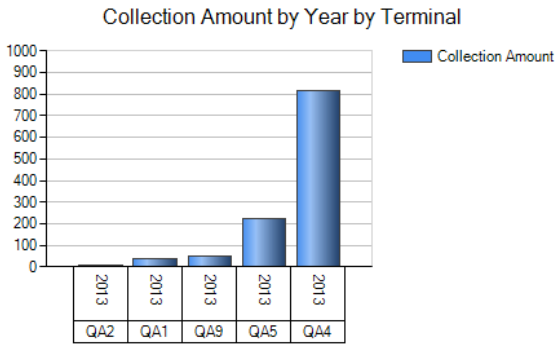
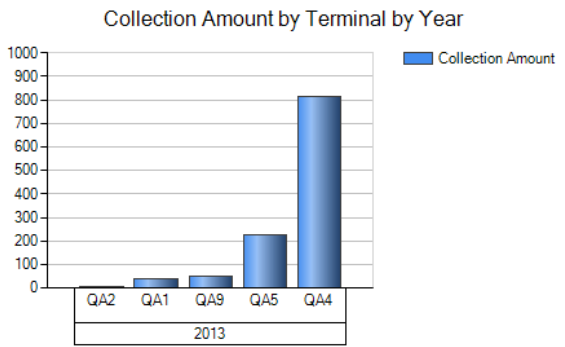
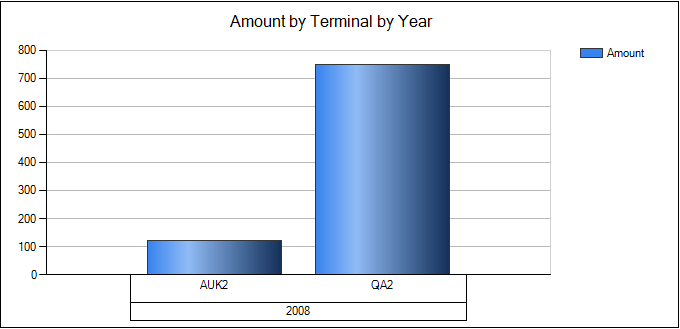
To enhance the appearance of the graph so that it displays ‘Amount by Terminal by Year’ instead of ‘Amount by Year by Terminal’, shift the order of the category items by dragging and dropping Year above Terminal.
The appearance of the graph is changed:
If your filter is set to display e.g. two different years, you may want the graph to display the year bars side by side for each terminal. Drag the Year category down to the Measures section. Select the years 2013 and 2012 from the edit categories pop-up. This is what the result could be.

Drag the Currency dimension to the Filters area and deselect all currencies but the Euro.
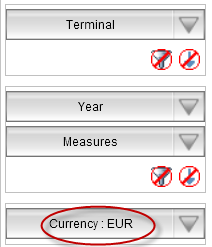
| Note: The values on the X-axis went down. The only indication on this filter is visible in the filter area only. |
Additional filtering.
To filter the result according to certain criteria, proceed as follows:
12.Click the filter icon (this is another filter icon) . The following window is displayed:
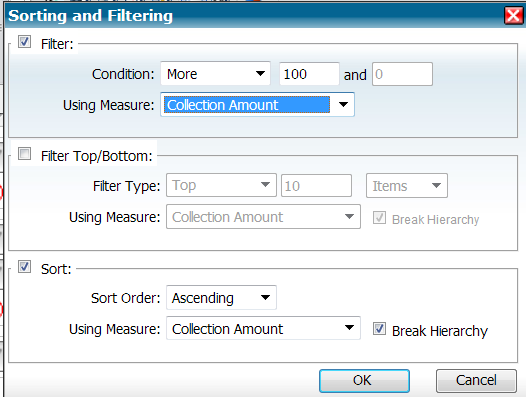
13.Select the Filter check box.
14.In the Condition list box, select More.
15.In the field next to the list box, enter 100.
16.In the Using Measure list box, select Amount.
17.Click OK. This is what the graph might look like:
The result is limited to terminals whose collection amount is above 100.
To limit the result to a top/bottom statistics list of the best/worst performing terminals, select Filter Top/Bottom in the Sorting and Filtering window. Then select the desired options in the Filter Type list boxes/field.
Save the analysis report.
This is how to save an analysis report:
18.Click . The following window is displayed:
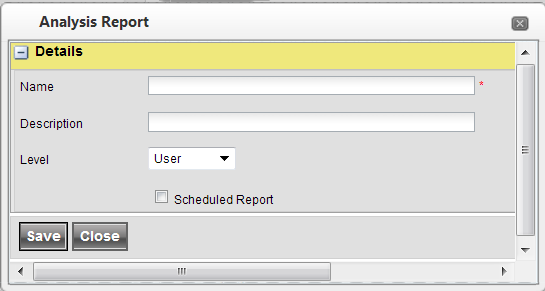
Add a name and description. Optional make the report available for the whole company with the level field.
 | The pop-up also allows for the report to be scheduled. See Export to Excel or PDF for a detailed description on how to use this. |
19.Click Save.
The report will be available in the list box top left the next time you visit the analysis page.