To explain the calculation method, we use an example depicted in the tables below.
•The parking Zone has 10 spaces
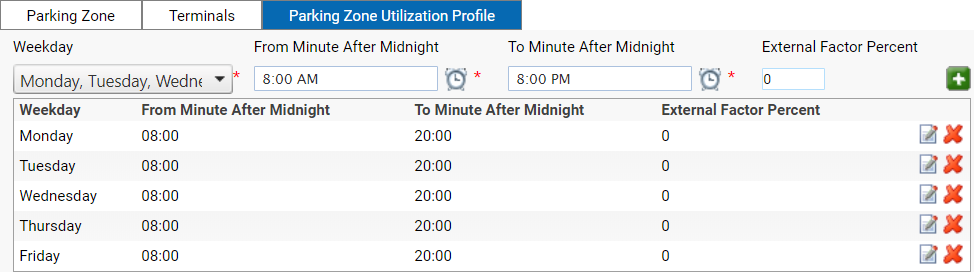
•The paid time frame runs from 08:00 up to excluding 20:00 (the green marked range)
•Each space has 60 minutes per hour of paid time resulting in 600 minutes Max utilization per paid hour. Hours outside the time frame set in the Parking Zone Utilisation Profile are set to zero (0).
Depicted the example as a table for each hour:
Hour |
Max Utilization |
|---|---|
5 |
0 |
6 |
0 |
7 |
0 |
8 |
600 |
9 |
600 |
10 |
600 |
11 |
600 |
12 |
600 |
13 |
600 |
14 |
600 |
15 |
600 |
16 |
600 |
17 |
600 |
18 |
600 |
19 |
600 |
20 |
0 |
Calculating the used time per purchase per hour is displayed in the table below. All purchases are summarized per hour giving the total paid parking time per hour in minutes.
Additionally, the number of the started sessions and the end of sessions is calculated to help with the Analysis of the data in the Paid Occupancy Analysis tool
Purchase per Hour |
05:57 to 11:23 |
07:59 to 09:41 |
10:09 to 15:16 |
Sum |
Sessions Started |
Sessions Ended |
Session Count |
|---|---|---|---|---|---|---|---|
5 |
3 |
|
|
3 |
1 |
|
1 |
6 |
60 |
|
|
60 |
|
|
1 |
7 |
60 |
1 |
|
61 |
1 |
|
2 |
8 |
60 |
60 |
|
120 |
|
|
2 |
9 |
60 |
41 |
|
101 |
|
1 |
2 |
10 |
60 |
|
51 |
111 |
1 |
|
2 |
11 |
23 |
|
60 |
83 |
|
1 |
2 |
12 |
|
|
60 |
60 |
|
|
1 |
13 |
|
|
60 |
60 |
|
|
1 |
14 |
|
|
60 |
60 |
|
|
1 |
15 |
|
|
16 |
16 |
|
1 |
1 |
16 |
|
|
|
|
|
|
|
17 |
|
|
|
|
|
|
|
18 |
|
|
|
|
|
|
|
19 |
|
|
|
|
|
|
|
20 |
|
|
|
|
|
|
|
From the sum from the table above the occupancy is calculated by dividing the paid minutes (120 for 08:00) by the maximum (600) giving 20%.
Hour |
Occupancy |
|---|---|
5 |
|
6 |
|
7 |
|
8 |
20% |
9 |
17% |
10 |
19% |
11 |
14% |
12 |
10% |
13 |
10% |
14 |
10% |
15 |
3% |
16 |
0% |
17 |
0% |
18 |
0% |
19 |
0% |
20 |
|
21 |
0 |
22 |
0 |
23 |
0 |
Calculating the used time per purchase per hour is displayed in the table below. All purchases are summarized per hour giving the total paid parking time per hour in minutes.
Purchase per Hour |
05:57-11:23 |
07:59-09:41 |
10:09-15:16 |
Sum |
|---|---|---|---|---|
5 |
3 |
|
|
3 |
6 |
60 |
|
|
60 |
7 |
60 |
1 |
|
61 |
8 |
60 |
60 |
|
120 |
9 |
60 |
41 |
|
101 |
10 |
60 |
|
51 |
111 |
11 |
23 |
|
60 |
83 |
12 |
|
|
60 |
60 |
13 |
|
|
60 |
60 |
14 |
|
|
60 |
60 |
15 |
|
|
16 |
16 |
16 |
|
|
|
0 |
17 |
|
|
|
0 |
18 |
|
|
|
0 |
19 |
|
|
|
0 |
20 |
|
|
|
0 |
21 |
|
|
|
0 |
22 |
|
|
|
0 |
23 |
|
|
|
0 |
Form the sum from the table above the occupancy is calculated by dividing the paid minutes (120 for 08:00) by the maximum (600) giving 20%
Additionally, the number of the started sessions and the end of sessions is calculated to help with the Analysis of the data in the Paid Occupancy Analysis tool
Hour |
Occupancy |
Sessions Started |
Sessions Ended |
Session Count |
|---|---|---|---|---|
5 |
|
1 |
0 |
1 |
6 |
|
0 |
0 |
1 |
7 |
|
1 |
0 |
2 |
8 |
20% |
0 |
0 |
2 |
9 |
17% |
0 |
1 |
2 |
10 |
19% |
1 |
0 |
2 |
11 |
14% |
0 |
1 |
2 |
12 |
10% |
0 |
0 |
1 |
13 |
10% |
0 |
0 |
1 |
14 |
10% |
0 |
0 |
1 |
15 |
3% |
0 |
1 |
1 |
16 |
0% |
0 |
0 |
0 |
17 |
0% |
0 |
0 |
0 |
18 |
0% |
0 |
0 |
0 |
19 |
0% |
0 |
0 |
0 |
20 |
|
0 |
0 |
0 |
21 |
|
0 |
0 |
0 |
22 |
|
0 |
0 |
0 |
23 |
|
0 |
0 |
0 |