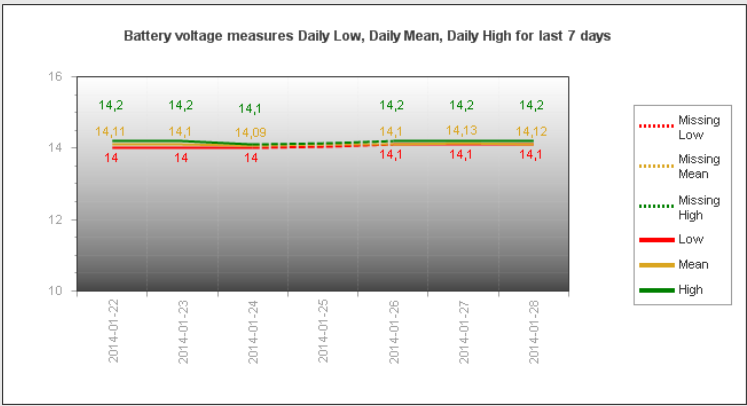
 The Terminal Measurements tab shows the measurement data received from the terminal during the last 7 days. Depending on the terminal type, an additional graph can become visible for a backup battery. This graph will not be shown if no data is present for the last 7 days.
Values measured are:
•Graph 1, Battery voltage measures Daily Low.
•Graph 1, Battery voltage measures Daily Mean.
•Graph 1, Battery voltage measures Daily High.
•Graph 2, Battery voltage raw measures.
•Graph 3, GSM measures Daily Low.
•Graph 3, GSM measures Daily Mean.
•Graph 3, GSM measures Daily High.
•Graph 4, GSM Raw measures.
The graphs 2 and 4 will be only be visible if data is available for this measurement.
If; for some reason; data is missing, the gap will be closed with a dotted line.
| Note: In CWT version 2.34, the Modem signal strength can only be measured during start-up. If the sampling period is set to 1 or larger, this initial value will be sent to WebOffice every time the terminal sends the data. |

Battery Voltage measures. The missing data gap will be closed using a dotted line