| Menu | Reports & Statistics -> Collection -> Overview report. |
The Collection – Overview report shows an overview of collections made from terminals in your company by date and pay unit.
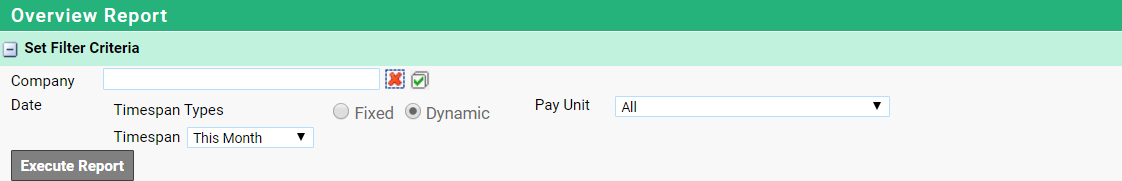
1.Select the desired time span type.
•Fixed: Lets you specify an interval of fixed dates and times, e.g. between the 21st of May at 09:00 and the 21st of June at 23:59.
•Dynamic: Let’s you select a dynamic time span, e.g. Last Week or This Month. For explanations of the different options, see Date filters.
2.In the Pay Unit list box, select the desired pay unit to limit the report to a specific pay unit or keep the ‘All’ setting.
3.Click Execute Report. The report is generated as both a graph and a grid.
To exclude details before exporting the report, the desired rows can be collapsed using the  controls.
For instructions on how to export the report to different formats, see Report pages.

The graph part of the report.

The grid part of the report.