| Menu | Reports & Statistics -> Occupancy WebOffice HUB -> Occupancy -> Historical Paid Occupancy |
 The Historical Paid Occupancy map displays the occupancy over time.
To be able to use this, Parking Zones must be set up with Terminals assign to it. Each Parking Zone must also have a Parking Zone Utilization Profile set up.
All purchase made in a Parking zone are then Calculated against the profile and saved as occupancy per day per hour. This can be made available on the Historical Paid Occupancy map.
On first opening of the page will centre on the parking zones in your company and display them as dots on the map.

Using the Historical Paid Occupancy Map.
To use the map, you must first select the period you want to analyse.
| Note: Taking a large period will take a long time to animate, especially when running the animation per hour. Best to start with a week in a period where you expect occupancy issues. |
1.Select the Start date of the period and optionally set a start time.
2.Select the end date of the period and optionally set an end time.
3.Optionally, select the week days to analyse.
4.Optionally, select the hours of the day.
5.Apply the filter.
A Loading Icon will be visible during the loading of the data.
| Warning: The amount of data is limited to 200 samples per zone. This is good for about 6 months in Daily mode and a week in Hourly mode. An error is displayed if more than 200 samples are needed. If this happens reduce the time frame. |
| Note: Due to that the animation is run on your PC all the data must be downloaded to your PC before you are able to run the animation. Starting the animation strait after applying the filter may cause the first hours not to display correctly. In that case just re-run the animation. |
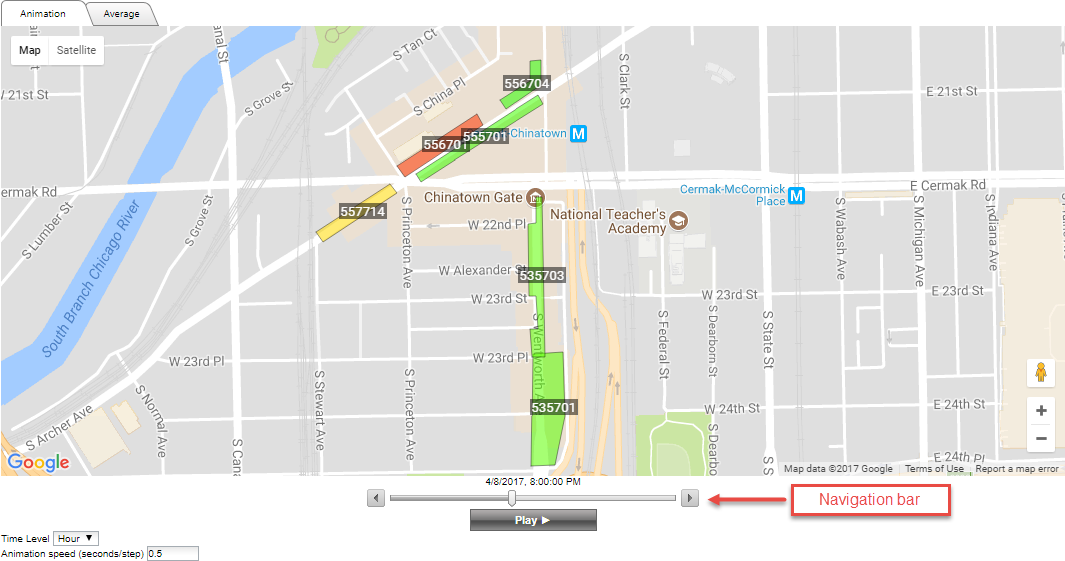
Running the animation.
Before running the animation:
•Set the time level to Hour or Day.
•Zoom in to the parking zones you want to see.
•Set the animation speed.
•Click play >.
The navigation bar will become available.
The percentage of occupancy is displayed in a 3-colour gradient continues scale from green (low occupancy) via yellow (50% occupancy) to red (high occupancy).

Stop the animation when you want to inspect a specific time frame.
Click on the parking Zone to inspect.
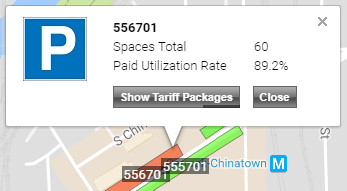
A Pop-up Will display the utilization rate for the selected zone. The exact time for the time frame is visible just above the Navigation bar.
A pop-up can be kept visible during the animation.
Clicking the [Show Tariff Packages] button will replace the pop up with a pop up displaying the Tariff Packages used in the zone.
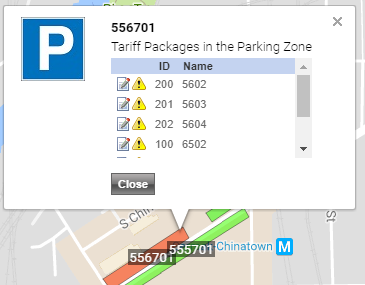
If an exclamation sign is displayed in front of a tariff package, this package is also used outside of the zone in other zones or in stand-alone terminals.
Clicking on the Edit icon will take you the Tariff Editor for the selected Tariff Package.
| Note: The Tariff editor is a work in progress. the description of this feature may be different from the current released version. |